반응형
SpaCy 는 인기 있고 사용하기 쉬운 Python의 자연어 처리 라이브러리입니다. 정확도와 속도가 매우 높은 라이브러리이지만 상대적으로 새로운 NLP 라이브러리이기 때문에 NLTK 만큼 널리 채택되지 않고 있습니다.
Spacy 수행을 위해 Data Sample은 아래와 같습니다.
1. Data 알아보기
error_bad_lines=False Option을 이용하여 문제가 되는 Line을 무시한다.
import pandas as pd
import numpy as np
import seaborn as sns
import matplotlib.pyplot as plt
import base64
import string
import re
from collections import Counter
from nltk.corpus import stopwords

stopwords = stopwords.words ( 'english')
df = pd.read_csv (r'C:\\Users\HANA\\PycharmProjects\\HANATOUR\NLP\\TEXT_Example\\research_paper.csv',  sep=',', error_bad_lines=False)
print(df.head())
print(df.info())
Title과 Conference의 값이 나옵니다. 각 Conference에 대한 Text에 대한 텍스트 분류를 합니다.
                                               Title Conference
0  Innovation in Database Management: Computer Sc...       VLDB
1  High performance prime field multiplication fo...      ISCAS
2  enchanted scissors: a scissor interface for su...   SIGGRAPH
3  Detection of channel degradation attack by Int...    INFOCOM
4  Pinning a Complex Network through the Betweenn...      ISCAS
Data에 결측값이 있는지 체크합니다. 없더군요.
print(df.isnull().sum())
test와 train을 나누고 유형을 확인한 후 Conference에 대한 데이타 분포를 그래프로 그래봅니다.
from sklearn.model_selection import train_test_split
train, test = train_test_split(df, test_size=0.33, random_state=42)
print('Research title sample:', train['Title'].iloc[0])
print('Conference of this paper:', train['Conference'].iloc[0])
print('Training Data Shape:', train.shape)
print('Testing Data Shape:', test.shape)

fig = plt.figure(figsize=(8,4))
sns.barplot(x = train['Conference'].unique(), y=train['Conference'].value_counts())
plt.show()
5개의 Conference로 나누어지고 INFOCOM관련 문서가 많음을 확인하였습니다.
Research title sample: Cooperating with Smartness: Using Heterogeneous Smart Antennas in Ad-Hoc Networks.
Conference of this paper: INFOCOM
Training Data Shape: (1679, 2)
Testing Data Shape: (828, 2)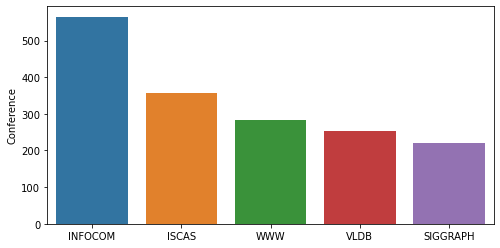
Spacy를 이용하여 Text 전처리를 시행하겠습니다. en_core_web_sm을 로드하기 위해 코맨드 창에 "python -m spacy download en_core_web_sm"을 시행한 후 하기 프로그램을 실행합니다.
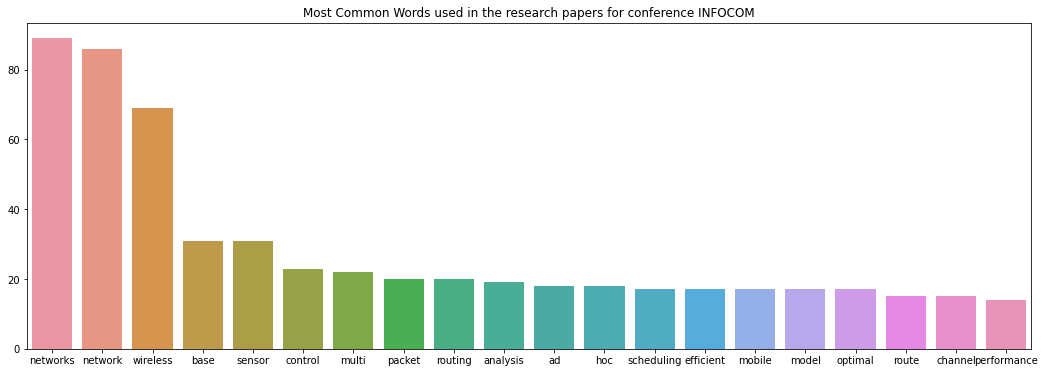
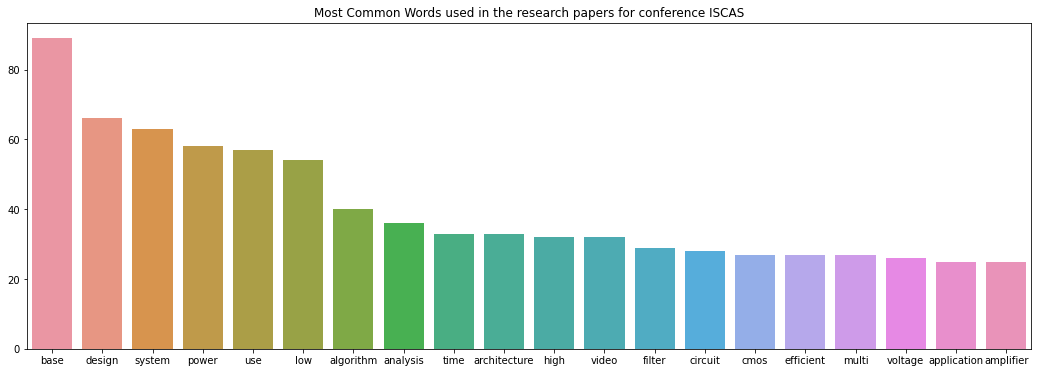
이 후 INFOCOM과 ISCAS Conference에서 가장 많이 사용한 단어 Top 10을 가져옵니다.
#python -m spacy download en_core_web_sm

import spacy
nlp = spacy.load('en_core_web_sm')
punctuations = string.punctuation

def cleanup_text(docs, logging=False):
    texts = []
    counter = 1
    for doc in docs:
        if counter % 1000 == 0 and logging:
            print("Processed %d out of %d documents." % (counter, len(docs)))
        counter += 1
        doc = nlp(doc, disable=['parser', 'ner'])
        tokens = [tok.lemma_.lower().strip() for tok in doc if tok.lemma_ != '-PRON-']
        tokens = [tok for tok in tokens if tok not in stopwords and tok not in punctuations]
        tokens = ' '.join(tokens)
        texts.append(tokens)
    return pd.Series(texts)
INFO_text = [text for text in train[train['Conference'] == 'INFOCOM']['Title']]
IS_text = [text for text in train[train['Conference'] == 'ISCAS']['Title']]
INFO_clean = cleanup_text(INFO_text)
INFO_clean = ' '.join(INFO_clean).split()
IS_clean = cleanup_text(IS_text)
IS_clean = ' '.join(IS_clean).split()
INFO_counts = Counter(INFO_clean)
IS_counts = Counter(IS_clean)
INFO_common_words = [word[0] for word in INFO_counts.most_common(20)]
INFO_common_counts = [word[1] for word in INFO_counts.most_common(20)]

fig = plt.figure(figsize=(18,6))
sns.barplot(x=INFO_common_words, y=INFO_common_counts)
plt.title('Most Common Words used in the research papers for conference INFOCOM')
# plt.show()

IS_common_words = [word[0] for word in IS_counts.most_common(20)]
IS_common_counts = [word[1] for word in IS_counts.most_common(20)]

fig = plt.figure(figsize=(18,6))
sns.barplot(x=IS_common_words, y=IS_common_counts)
plt.title('Most Common Words used in the research papers for conference ISCAS')
# plt.show()
Spacy를 이용하여 다른 방법의 텍스트 정리를 해보겠습니다.
STOPLIST = set(stopwords.words('english') + list(ENGLISH_STOP_WORDS))
SYMBOLS = " ".join(string.punctuation).split(" ") + ["-", "...", "”", "”"]


class CleanTextTransformer(TransformerMixin):
    def transform(self, X, **transform_params):
        return [cleanText(text) for text in X]

    def fit(self, X, y=None, **fit_params):
        return self


def get_params(self, deep=True):
    return {}


def cleanText(text):
    text = text.strip().replace("\n", " ").replace("\r", " ")
    text = text.lower()
    return text


def tokenizeText(sample):
    tokens = parser(sample)
    lemmas = []
    for tok in tokens:
        lemmas.append(tok.lemma_.lower().strip() if tok.lemma_ != "-PRON-" else tok.lower_)
    tokens = lemmas
    tokens = [tok for tok in tokens if tok not in STOPLIST]
    tokens = [tok for tok in tokens if tok not in SYMBOLS]
    return tokens

def printNMostInformative(vectorizer, clf, N):
    feature_names = vectorizer.get_feature_names()
    coefs_with_fns = sorted(zip(clf.coef_[0], feature_names))
    topClass1 = coefs_with_fns[:N]
    topClass2 = coefs_with_fns[:-(N + 1):-1]
    print("Class 1 best: ")
    for feat in topClass1:
        print(feat)
    print("Class 2 best: ")
    for feat in topClass2:
        print(feat)
빈도가 가장 높은 Feature들을 나타내고 Pipeline을 이용하여 LinearSVC를 이용하여 회귀확률을 구합니다.
vectorizer = CountVectorizer(tokenizer=tokenizeText, ngram_range=(1,1))
clf = LinearSVC()

pipe = Pipeline([('cleanText', CleanTextTransformer()), ('vectorizer', vectorizer), ('clf', clf)])
# data
train1 = train['Title'].tolist()
labelsTrain1 = train['Conference'].tolist()
test1 = test['Title'].tolist()
labelsTest1 = test['Conference'].tolist()
# train
pipe.fit(train1, labelsTrain1)
# test
preds = pipe.predict(test1)
print("accuracy:", accuracy_score(labelsTest1, preds))
print("Top 10 features used to predict: ")

printNMostInformative(vectorizer, clf, 10)
pipe = Pipeline([('cleanText', CleanTextTransformer()), ('vectorizer', vectorizer)])
transform = pipe.fit_transform(train1, labelsTrain1)
vocab = vectorizer.get_feature_names()
for i in range(len(train1)):
    s = ""
    indexIntoVocab = transform.indices[transform.indptr[i]:transform.indptr[i+1]]
    numOccurences = transform.data[transform.indptr[i]:transform.indptr[i+1]]
    for idx, num in zip(indexIntoVocab, numOccurences):
        s += str((vocab[idx], num))
반응형
'NPL with ML' 카테고리의 다른 글
| Python 머신러닝, 한글 감정분석을 위한 리뷰 분석 : 프로그램부터 실전적용까지 (rhinoMorph이용 (0) | 2020.12.12 |
|---|---|
| 텍스트 분석 실습 - Mercari Price Suggestion Challenge (0) | 2020.11.25 |
| 토픽 모델링 [Topic Modeling] - LDA기법 소스포함 (0) | 2020.11.17 |
| 감성 분석 (Sentiment Analysis) - 비지도학습 기반, VADER (0) | 2020.11.13 |
| 감성 분석 (Sentiment Analysis) - 지도학습 기반 (0) | 2020.11.12 |
| 문서 유사도 측정 - 코사인 유사도(Cosine Similarity)와 실전 연습 코드 (0) | 2020.11.08 |
| 한글 텍스트 처리 위한 KoNLPy를 이용한 네이버 영화 평점 감정 분석 (0) | 2020.11.01 |
| 문서 군집화 실전 예제 - Opinion Review Data Set (0) | 2020.11.01 |


